Back to Power Usage Sensor Overview – On to Power Usage Daily View
Power Usage Sensor data is automatically formatted into three daily charts: AHRs In/Out, Equivalent Battery Units (EBUs), and Time in Stage. Click the tab to view the graph. Use the controls in the header to change time span, move around the test data and print the graph.
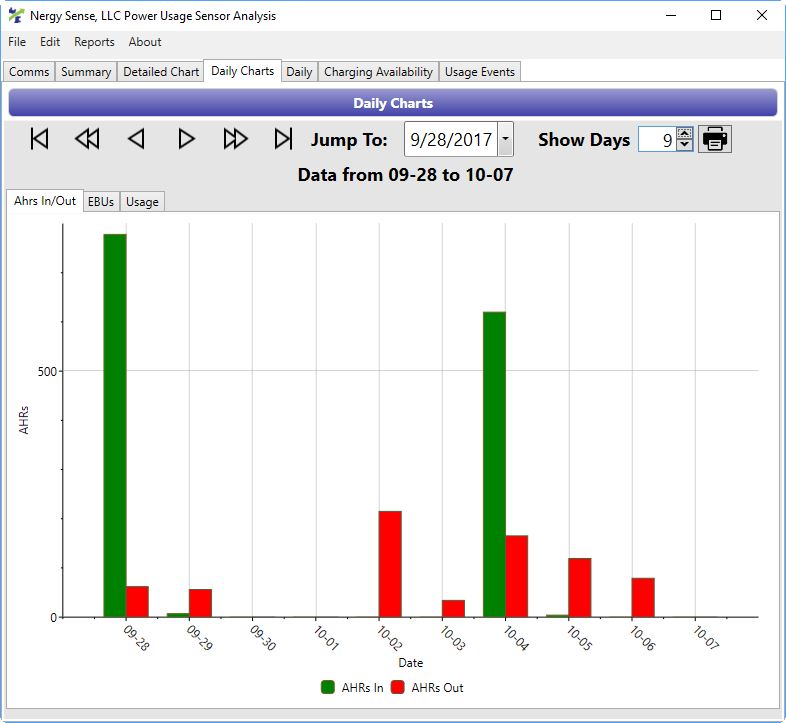 Daily AHRs In/Out
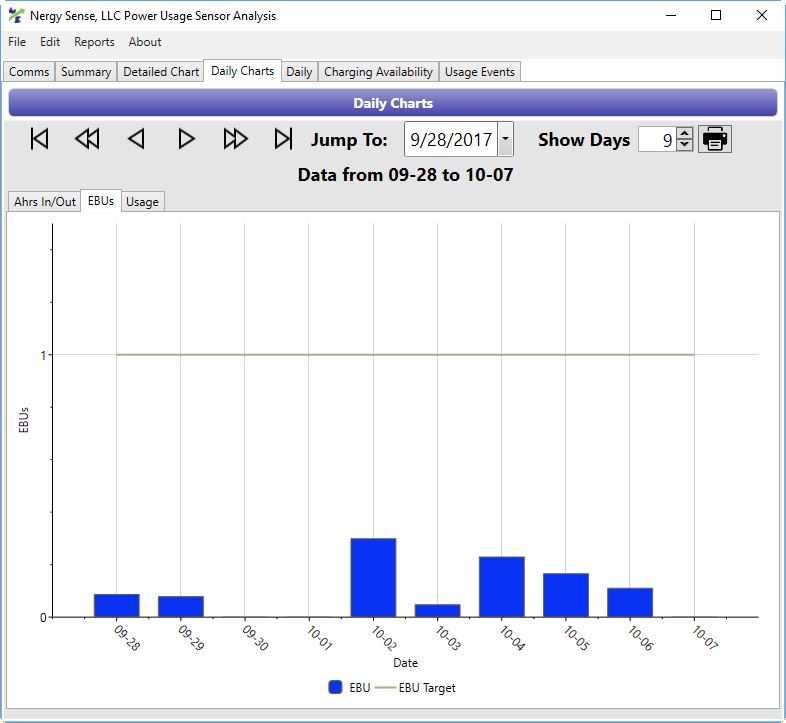 EBU View
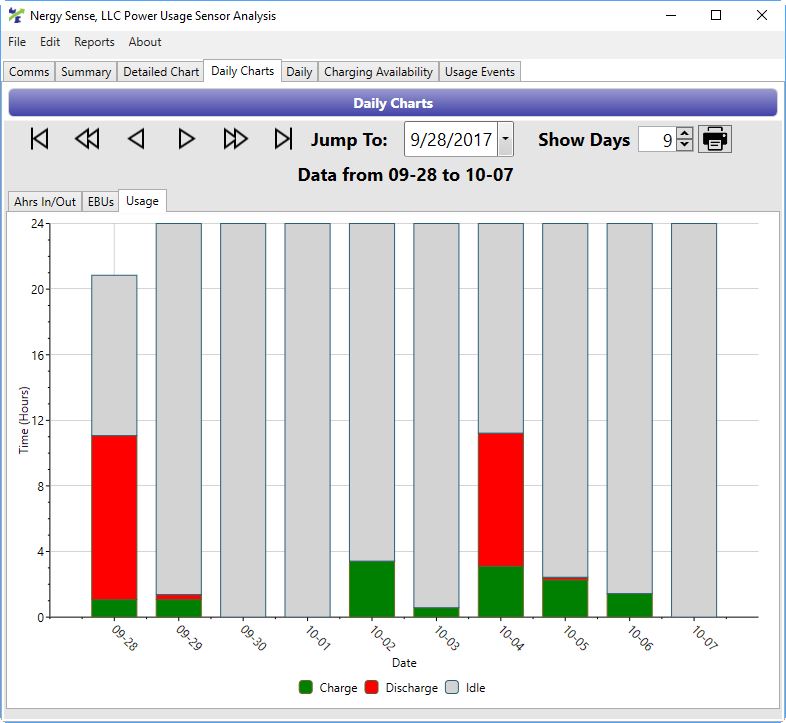 Time in Stage