Back to Daily Charts – On to Event View
The Daily View summarizes your test data by 24 hour days. Use the Project Settings to establish the start of the day, so the data better matches your operations schedule.
The Daily View summarizes your test data by 24 hour days. Use the Project Settings to establish the start of the day, so the data better matches your operations schedule.
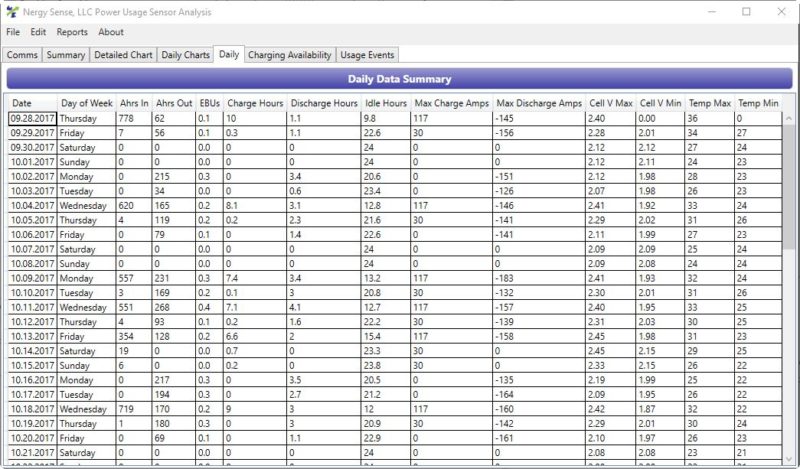 Daily View